
 Demographic indicators
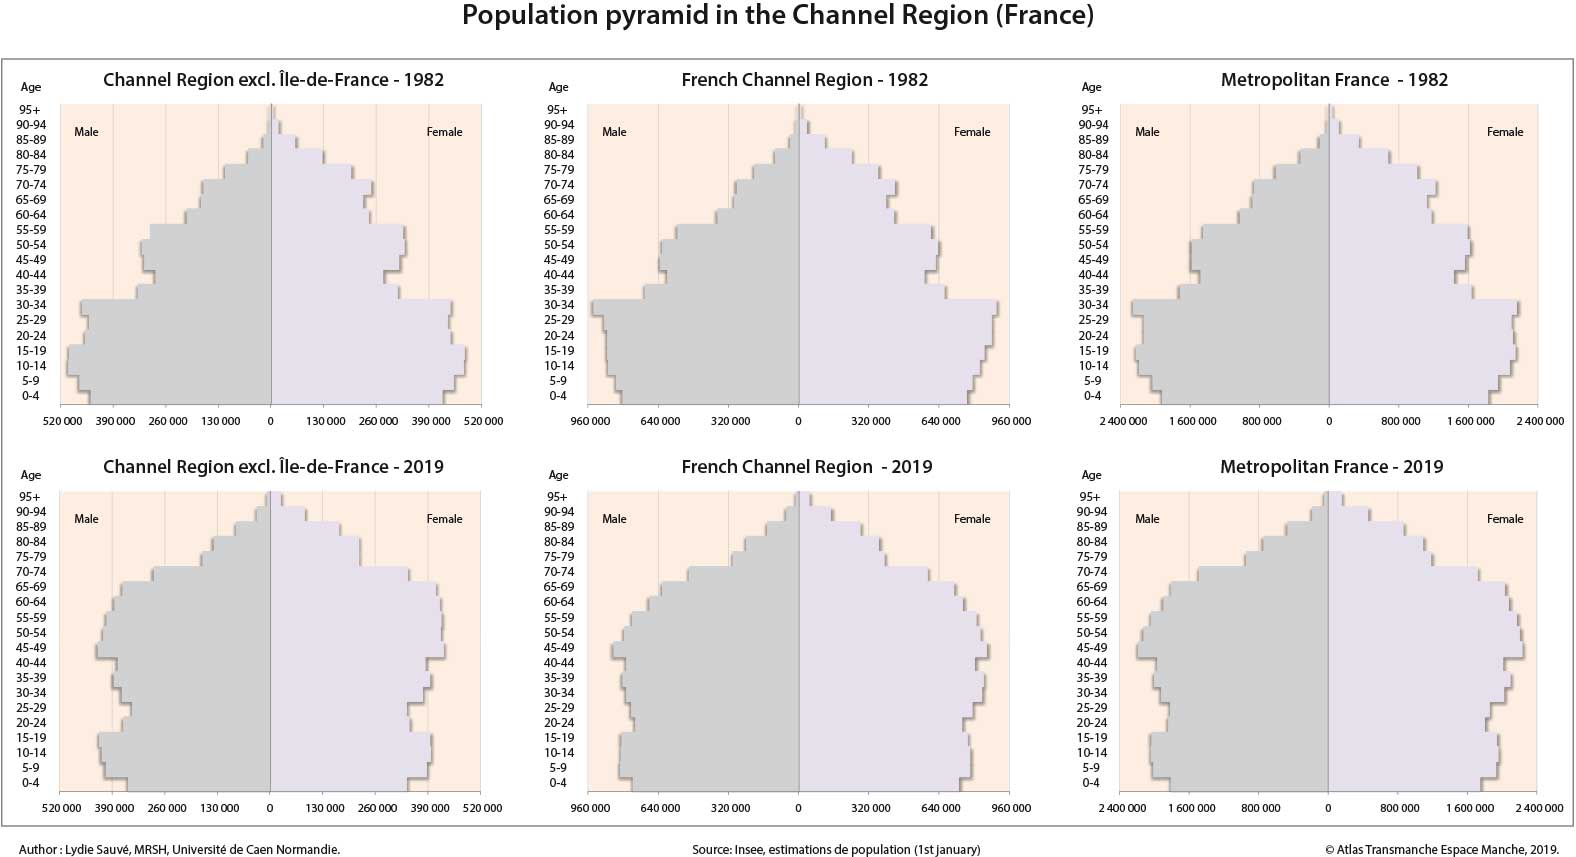
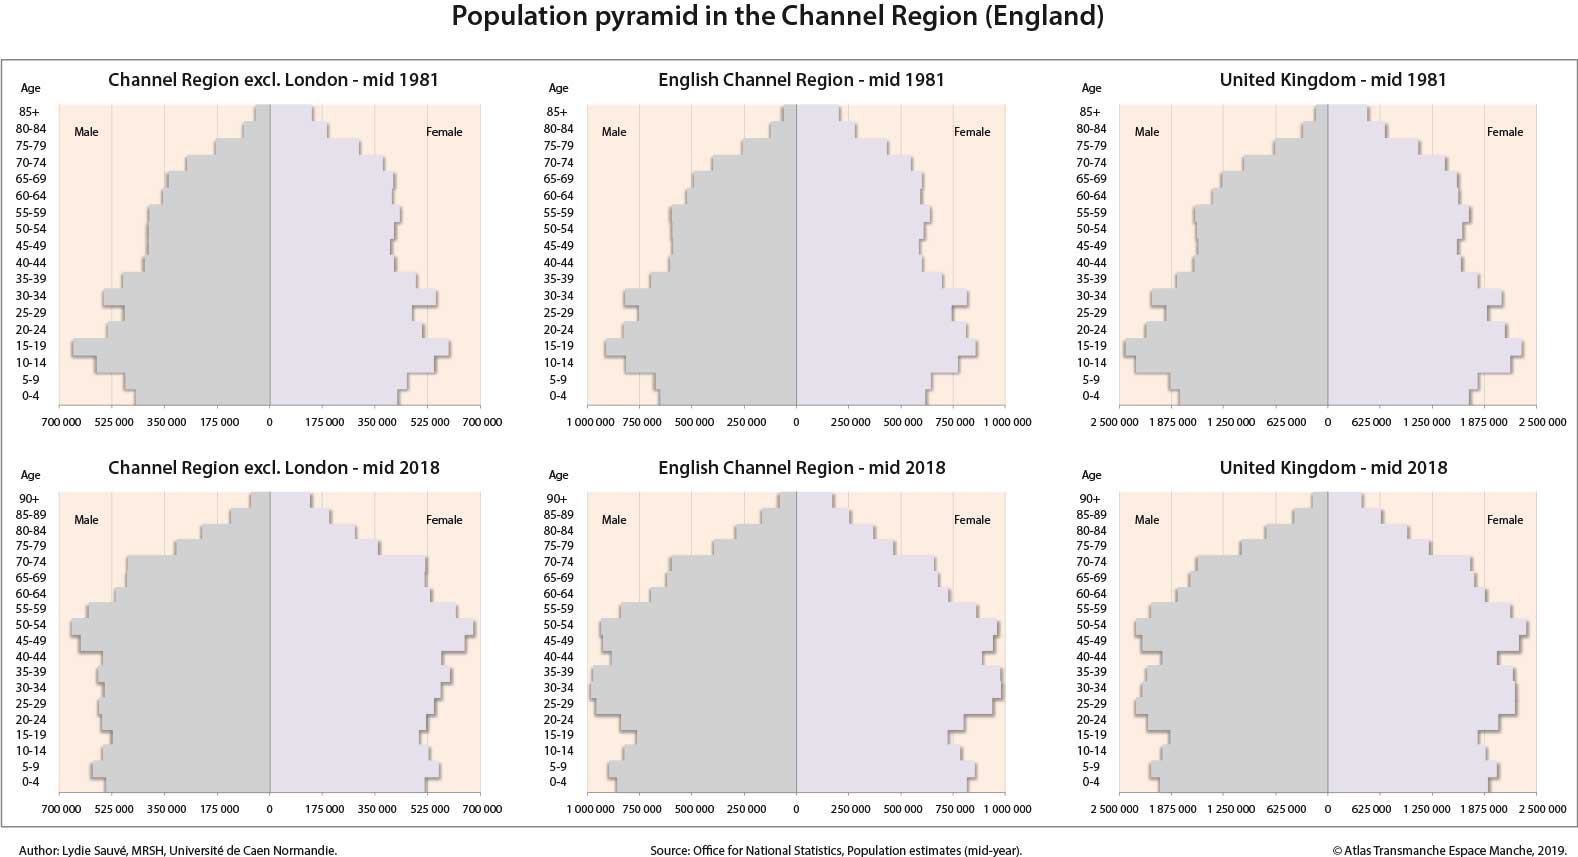
Population pyramids for Channel Region in 1982 and 2019 reflect the demographic changes of the last decades and the marked trend in ageing population.
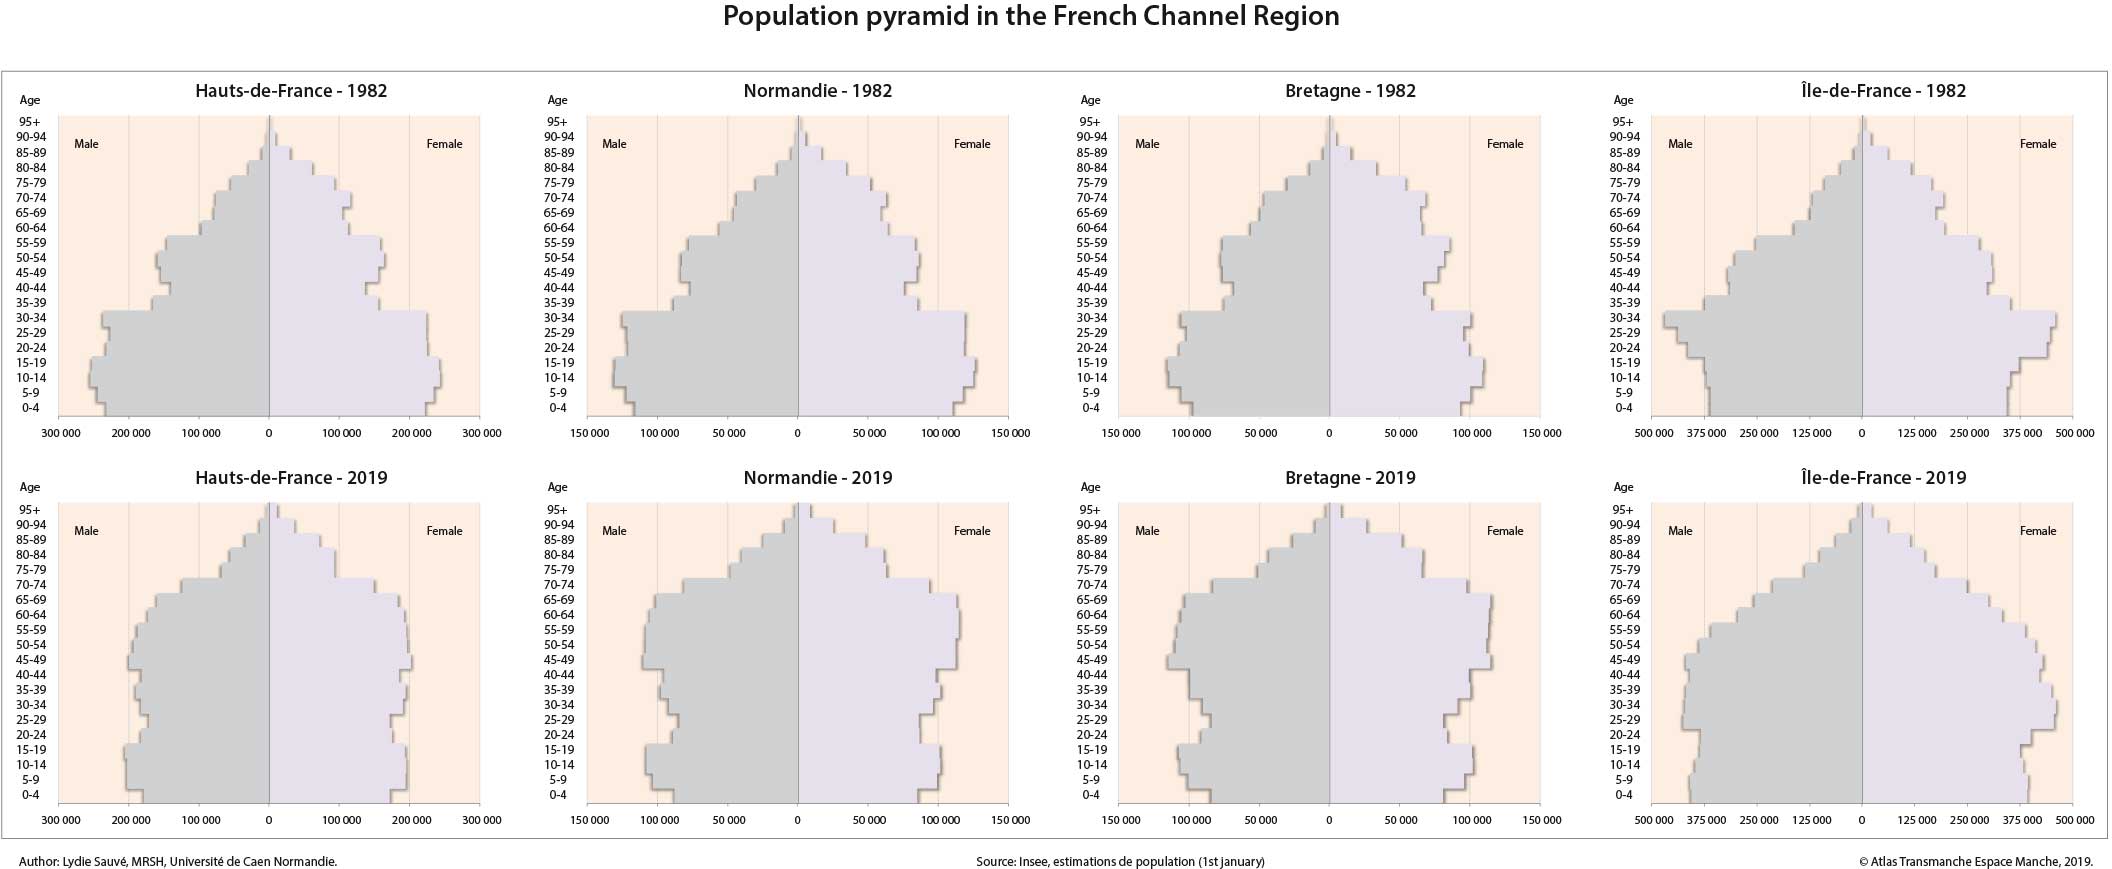
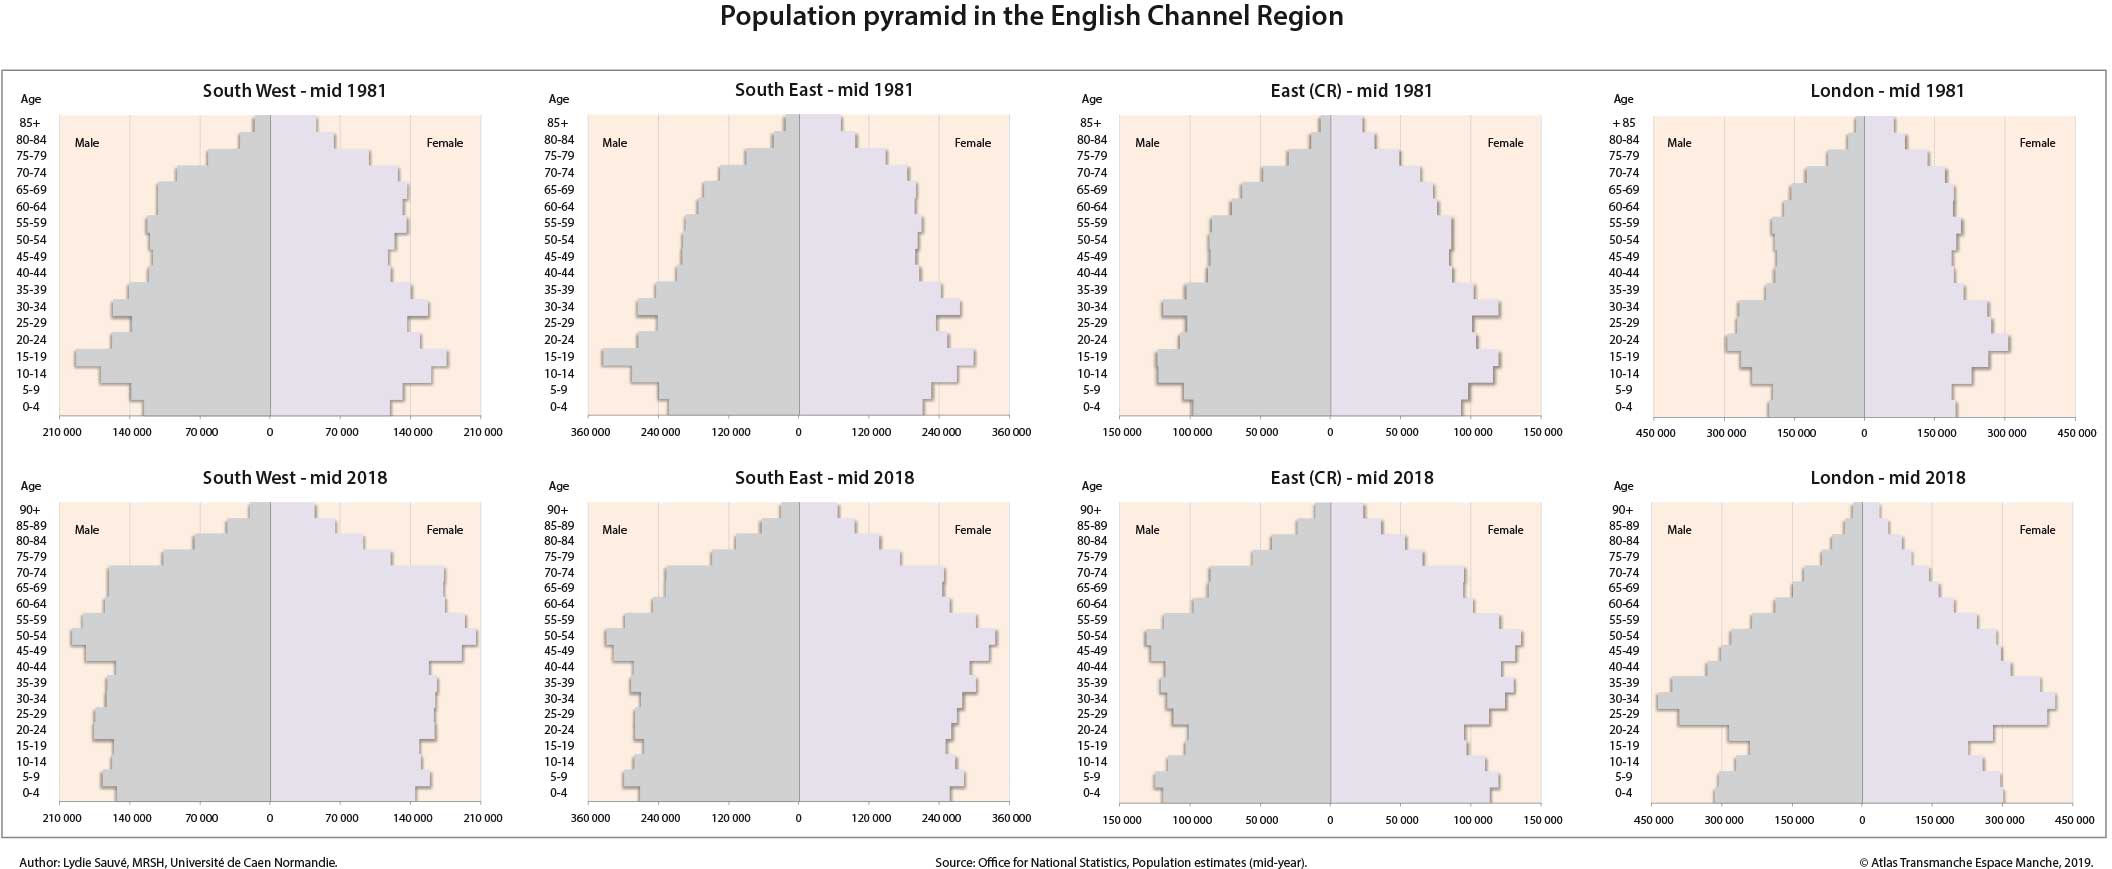
The shapes of the pyramids have evolved: hollows and bulges reflect the demographic transitions, birth rates, death rates and life expectancy of the population. The losses of population during World War 1; decrease of live births and high deaths rates, still remained visible in 1982; and have given way to the post-World War 2 baby boom generation. The low proportion of elderly people gave a “maple leaf” shape to the pyramids. The increase of older age-groups, the post-World War 2 baby boom generation turned 70 in 2016; higher life expectancy; have transformed the shape of the age pyramids in “cylinder” in 2019.
Each coastal region shows a similar type of pyramid, although ageing was more marked on the English side in 1982 due to lower live birth rates than in France. Ile-de-France and London regions have different distribution of age structure. For London in 2019, the greater proportion group is the 25-49 age group corresponding to people of working age. In Ile-de-France, the shape differs; the different age groups are almost identical between 0 and 60 years old.
In France as well as in United Kingdom, low birth rates and higher life expectancy are transforming the shape of the population pyramid towards a much older population structure. As a result, the proportion of people of working age is shrinking while the relative number of those retired is expanding. The share of older persons in the total population will increase significantly in the coming decades, as a greater proportion of the post-war baby-boom generation reaches retirement.
top


